Urban Informatics
Land use dynamics and fragmentation of settlements is a crucial question for urban planning. In the general framework of sustainability objectives, the policies that control a suitable process of urbanization increasingly involve a deep knowledge of complex criteria of location chosen by the different agents. Planners realize that it is crucial to understand and provide the best possible explanation for the observed spatial distribution of urban activities. Principles and technologies of Artificial Intelligence (AI) in general, and of Neural Networks (NN) and Cellular Automata (CA) in particular, offer the potential to increase the knowledge in urban dynamics by multiplying the information capacity of the GIS (Geographic Information System) and by offering a new approach to territorial modeling. Most geocomputation currently deals with models on spatiotemporal dynamics in urban land-use and morphogenesis.

Figure 1. GPS Map and location tagging for the “City Upgrade” project by ORTLOS Space Engineering
In this context CA appear to be the most attractive and favored technique for implementing high resolution models of spatial dynamics for a number of reasons (Wolfram, 2002):
- They are inherently spatial; their definition on a raster of cells, and on neighboring relationships are crucial;
- They are simple and computationally efficient;
- They are process models that deal with state changes;
- They are dynamic and can then represent a wide range of situations and processes.
Recent developments in the natural algorithms, and particularly in Neural Networks, allow the reversal of the approach by learning the rules and behaviors directly from the database, following an inductive bottom-up process. While the traditional modeling approach is based on explicit a priori rules formulation, through the Neural Networks processing approach, rules are found a posteriori on the base of a learning process of distributed “unit processing” architecture. The novelty of our approach lies in the use of NN as a powerful tool for prediction and for building virtual scenarios on urbanization processes. The results have been achieved through different categories of “training regimen” able to react to different information environment. The training processes can be divided into three basic categories (Wikipedia, April 2009): monitored training, supervised training, and self-organization. The monitored training is typical of associative networks, which are NN with essentially a single functional layer that associates one set of vectors x1, x2,…xn with another set of vectors y1, y2,…yn. Supervised training implies a regimen in which the NN is supplied with a sequence of examples (X1, Y1), (X2, Y2)…(Xk, Yk) of desirable or correct input/output pairs. As each input Xk is entered into the NN, the “correct output” Yk is also supplied to the network. In a study, the input is given by the territory information at time t and the “correct output” is the corresponding information at time t+1. Once the NN is trained and has learned the rules of transition, it will be able to produce the “desired” land use transformation of the present state of territorial system supplied as Input to the NN.
In self-organizing training, a network modifies itself in response to X Inputs. This category of training is able to obtain a surprisingly high number of information processing capabilities: development of pattern categories based on clustering, estimation of probability density functions, development of continuous topological mapping from Euclidean space to curved manifolds (Hecht-Nielsen, 1990)[1]. Self-organizing training includes the Self- Organizing Map (SOM)[2].
The NN SOM, a powerful tool of classification, have been developed mainly by Kohonen (1995)[3] between 1979 and 1982. The SOM are Self Organized NN, where the target is not predefined, but dynamically up during the learning phase. Their architecture comprises two layers: an input one, acting simply as a buffer, that doesn’t modify the data, and an output one, known as Kohonen layer (or matrix), which is formed by units regularly organized in the space and which evolves during the training following a spatial organization process of the data characteristics: the Feature Mapping. The construction of these maps allows a close examination of the relationships between the items in the training set. When the training phase has calculated the weight matrix, the map shows clusters where each input vector is assigned to the closest codebook in terms of minimum Euclidean distance.
The SOM attitude to “classify” makes it possible to perform a mapping with two main peculiarities:
- Clustering: the net performs a logical division of the input space into regions (cluster), associating a point in the N-dimensional input space to the two-dimensional output matrix. In the dimension reduction process, the principal components discriminating data are dominant.
- Self-organization: before the training the weights vectors topology depends only on the initializing criterion: if it is random, weights will be casually organized into their hyper-cube. The learning criterion tends to move the weights vectors towards the input vectors seen during the training. The vector moving affects not only the winner unit vector, but also its neighborhood according to a decreasing function.
The most difficult aspect of any location decision problem facing an urban planner/decision maker is uncertainty. Many types of uncertainty can be distinguished, caused by various reasons such as a lack of data, imperfect information, and uncertain future developments. Land suitability analysis typically involves the assessment of the suitability of land units without knowing the future spatial distribution of land use. Traditional planning techniques have used “algebraic equations” to express land suitability as a weighted function of suitability scores across multiple criteria. However, the existing multi-criteria evaluation methods do not systematically account for uncertainty about the land use in adjacent and other cells. In particular, Bayesian decision networks[4] are suggested as a means of knowledge representation for agents in a multi-agent land use simulation system. Bayesian decision networks model the uncertainty in terms of probabilities specified in the network representing the expertise of specialists with respect to specific land uses.
Knowledge representation refers to the way in which knowledge of experts is modeled. As discussed, for the envisioned planning support system, the knowledge representation format should be able to deal with uncertainty and allow probabilistic reasoning based on beliefs under conditions of uncertainty. Therefore, agent or expert knowledge could be represented using Bayesian Decision Networks (e.g., Neapolitan 1990[5]; Ames 2002[6]). Bayesian decision networks can model uncertainty and provide a framework for representing cause and effect relationships between variables in a decision problem. A Bayesian decision network consists of three types of nodes: decision nodes, nature nodes and utility nodes (see Figure bellow).

Figure 2. shows general structure of Bayesian decision networks
Decision nodes represent the variables on which agents can make a decision. A network may have one or multiple decision nodes. In case of multiple decision nodes, modelers have to decide one the sequential order of these decision nodes. Nature nodes represent the variables over which the decision maker has no control. The outcomes of these nature nodes are typically uncertain to decision makers because nature decides on the value of outcome variables. Utility nodes represent the utility values, reflecting agents’ preferences for the possible states of the system being planned. In general, arrows in the network represent cause-effect relationships between nodes.
The project “City Upgrade” by ORTLOS Space Engineering, discusses uncertainty in decision-making. In trans-disciplinary environment during the creative collaboration, actors are constantly reacting upon unforeseen outcomes. In self-organizing bottom-up structures the decision making process has to be permanently adaptable to new learning and findings. This also questions an approach of master plan with pre-defined functional zoning and regulations. The project “City Upgrade” one of the major premises is “form follows feedback”. This principle is strongly connected to the knowledge representation. In multi-agents systems, no matter if we consider software agents or human actors, the user has to “know” that certain information is available in order to react and to establish relationship to it. The knowledge aware context is crucial for how we operate within and deal with certain system such as urban environment. However, this raises demands for infrastructural structures of high performance, as enabling platforms for future endeavors.

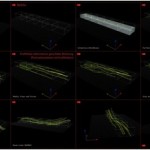
Figure 3. Project “City Upgrade” by ORTLOS Space Engineering – a geotagged area of high-performance “Boulevard of Production”.
The reason to introduce urban informatics within urban planning is a new paradigm change in our current living environments. Augmented realities radically reshape the living and working practice. In example, the creation and production processes get disconnected through global interconnectivity and logistic advances of new distribution channels (Anderson, 2006). Through worldwide accessibility, according to Chris Anderson’s theory of “the Long Tail”, this paradigm switch will have huge impact in domain of consumption behavior and cultural activity of citizens. This becomes obvious if we take a closer look at present infrastructural issues and demands. In past the infrastructure such as transportation network, power supply, local services availability etc. has been essential for progress of any urban community. Today it is not different. For any networked work places as well for urban community infrastructural challenges, leveraging ubiquitous computing technology is important to deliver state-of-the-art services. Some “smart” governments have already started upgrading of existing environments in order to match further demands. In my opinion, a very good example of this effort is the “u-City” project in South Korea.
Korea is the first country to envision and realize u-City. u-City can be thought as the next paradigm of urban development that employ IT to advance urban functions by several levels. Employing IT to enhance urban functions is not a new attempt as many cities are already using IT extensively in a variety of applications such as transportation, disaster control, law enforcement and facility management (Hwang, 2009)[7]. However, by utilizing new cutting-edge ubiquitous computing technologies, u-City introduces new innovative urban functions and socioeconomic paradigms that up until now have never been realized.
Although, cities in other nations have parallel focused on the deployment of their IT infrastructure including broadband or wireless networks (ICF, 2007; Bar & Park, 2005)[8], such initiatives were predominantly aimed to reinforce urban infrastructure. However, thus differed fundamentally from u-City, which focuses not only on the establishment of infrastructural aspects but more importantly on embedding intelligence into the urban environment (Hwang, 2009).
Mark Weiser[9], who inspired the concept of Korean u-City, defined ubiquitous computing as “the method of enhancing computer use by making many computers available throughout the physical environment, but making them effectively invisible to the user.” The basic idea behind ubiquitous computing was to make computers “autonomous agents that take on our goals” (Weiser, 1993)[10]. In other words, ubiquitous computing means embedding computing technologies in our physical surroundings so that virtual and physical objects may deliver services autonomously without human intervention.
With this understanding, ubiquitous computing has three distinct services in comparison with legacy IT. First, it supports real-time service (Fleisch, 2004)[11]. As digital space is integrated with the real world, ubiquitous computing can ensure prompt responses to events occurring in the real world. Since conventional IT relies on human input, there is bound to be room for lag and human error, an aspect that is minimal if not non-existent in ubiquitous computing. Second, since ubiqui tous computing system is context-aware, it can provide the optimum solution for a given situation (Schmidt, 2002)[12]. Third, objects and environments surrounding human beings offer services autonomously. Therefore, not only computers but also services are invisible to users. In case of u-City the city is configured to create the optimum service intelligently based on its real-time capacity as IT is embedded in physical environments that make up the city.
The roadmap of u-City shows that it will start from real-time data, move on the stage of context awareness, and finally at autonomous services. In that regard, one can talk here more about a vision rather then a project. Context awareness could have big impact on transportation system. For example, it can be calculated how long it will take to get to a traffic destination for each possible route, or assign a different parking spot by identifying when an elderly person or an infant is in the car. The final stage of autonomous services will enable automobiles to handle such tasks as filling up for gas or being able to make repairs by themselves while roads can automatically address changes in their condition, such as an accident or damage. However, it is not an easy task to forecast evolution of this vision, since the concept of context that computers have to cover keeps changing as technology and services continue to advance (Schmidt, 2002). Intelligent ability is applied not only to urban infrastructure, including transportation, communication, gas, and electricity but also to working places and social services, such as the environment and health care, which will raise the city’s value dramatically.
Existing cities and new cities take completely different approaches to building of ubiquitous city. While the holistic approach employed in new cities offers an advantage of implementing a larger number of advanced services, it requires great investments all at once and involves a higher risk of failure. Compared to this, although existing cities can provide intelligent services within a very limited range, it is easier to secure necessary investments and has relatively lower risk of failure due to its incremental evolution. From a technology perspective, it is necessary to define a standard platform for the variety of technologies utilized in u-City. Standardization is the area that is suffering market failure in relation to u-City. It benefits everyone if all stakeholders cooperate with each other and establish a common standard. However, if stakeholders maneuver to push for only their gains, this fails to produce a common good for everyone (Hwang, 2009).
Within such projects, the government plays a pivotal role in compensating for uncertainties and costs related with u-City. It is hard to expect investment or entrepreneurship from private businesses if uncertainties are high and the cost structure is unfavorable. On the other hand, it is not desirable to purely rely on free market mechanisms due to possible market failure. The government must construct necessary infrastructure first in order to lower the entry barriers for investors and companies. The government must actively encourage demand as well. In an emerging technology project like u-City network externalities make a significant difference. Initial demand plays a critical role in offsetting a vicious circle whereby weak demands discourage potential customers (Katz & Shapiro, 1985)[13]. The government must play an active role in encouraging convergence across different industries. One of the features characterizing ubiquitous IT services is that several industries converge with each other to provide a bundle of services (Fleisch 2004). In u-City, numerous services and urban functions, for instance, automobile traffic, entertainment, healthcare industry, converge. A policy framework has to guide IT, BT (bio technology) and NT (nano technology) across their individual boundaries. In addition, it must also place a priority on convergence in supporting R&D and product development initiatives, and improve the education system to reorient manpower development framework to transcend conventional boundaries between academic sectors.
The responsibilities of the city government and the willingness to support projects such as u-City, goes hand in hand with development and trust in open community platforms. If we understand the city as an enabling platform back-upped with appropriate infrastructure, then the users’ involvement and participation will be possible. On the micro level, the city-users are already “equipped” with necessary devices in order to take active part in re-shaping their urban environments or even creating new ones. The increasing deployment of sensors and hand-held electronics in recent years is allowing a new approach to the study of the built environment. The way we describe and understand cities is being radically transformed, alongside the tools we use to design them and impact on their physical structure. Studying these changes from a critical point of view and anticipating them is the goal of the SENSEable City Laboratory, a new research initiative at the Massachusetts Institute of Technology[14]. One of the sub-projects “City Wiki” deals with the development of real-time, location-sensitive tools for the city and is concerned with the real-time mapping of city dynamics. This mapping, however, is not limited to representing the city, but also instantly becomes an instrument for city inhabitants to base their actions and decisions upon in a better informed manner, leading to an overall increased efficiency and sustainability in making use of the city environment.

Fig. 4 – WikiCity Rome interface used for a 10×5-meter projection in a public square (Image by WikiCity project http://senseable.mit.edu/wikicity/rome/)
The importance of governmental and industry role has been mentioned, but involvement of city users and respectively local communities within open systems should not be underestimated. Many early innovations in location-based services came not from industry but from artists and researchers working with positioning technologies such as GPS in unconventional ways. In regard of urban informatics city upgrade strategy do not only establish context-aware structure for new information, but also visualize or geo-tag the information already existing.
Amsterdam Realtime (2002), a project by the WAAG society in association with Esther Polak, focused on tracing movements through the city of people carrying GPS enabled devices that transmitted their location in real-time to a remote server that in turn projected these movements as an animated “map” in the space of an art gallery[15]. This map represented the city not as a static network of streets, buildings, and open space, but as a series of traces that aggregate over time to represent the city as traversed by different people. Here, the traditional authority attributed to maps and their ability to structure the way we navigate cities is subverted. Rather than a map that informs how one moves through a city, one’s movements inform the map. Other projects include systems for open, public participation in annotating specific places or locations within the city for others to access. “Yellow Arrow” (2004), a global public art project originating in New York, employed simple SMS messaging techniques to enable people to “markup” the physical spaces of the city with virtual “tags” or “geo-annotations”– short text messages associated with a specific spot or location[16]. “Urban Tapestries” (2004/2006), a project by the London-based social research group Proboscis, further investigated this idea of “public authoring” of urban environments[17]. The project enabled people to create relationships between places and to associate text, images, sounds and videos with them. Using a mobile phone or PDA with wireless connectivity, project participants authored “pockets” consisting of text and media objects related to specific locations in the city. A series of pockets by a single author formed “threads” that connected these locations. Significantly, the system “enabled people not only to personally map their urban spaces, but also read the maps of the neighbours and strangers who share those spaces” (Silverstone and Sujon, 2005)[18]. City Flocks (Belzandic et. al., 2007) builds on the work of Proboscis in exploring how such systems might enable forms of “social navigation” that connect people unfamiliar with a city to the “local knowledge” of its residents. Social navigation is simply the act of asking people (or inferring from the actions of others) directions to something or some place you are looking for. Rather than consulting a map or city guide, one simply asks local residents for directions to a good café, or selects one filled with people, as this may sometimes be a good indicator of quality. City Flocks translates this common social practice into a digital information service: a mobile system enabling local residents to markup particular spots or locations within the physical city with digital annotations that include personal ratings, recommendations or comments.

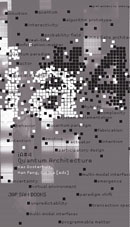
Fig. 5 – “City Lab” project by ORTLOS Space Engineering (within the project “City Upgrade”) visualize possible urban interventions as “upgrades”, spaces build upon the information as essential material.
In his book “The Image of the City” Kevin Lynch (1960)[19] attempted to distill a syntax through which a cognitive map of the city is formed over time, through habitual interactions with things like paths, districts, edges, landmarks and nodes. Location-based media and personal informatics suggest a shift from material/tangible cues (streets, squares, rivers, monuments, transportation hubs) to immaterial/ambient ones through which we form our cognitive maps (Shepard, 2008)[20]. Novel ideas about the social and cultural consequences of a whole assemblage of urban informatics technologies – locative technologies in particular, have been issued – especially in artistic practices – as a critical counterpart to over-all strategies as in Korean u-City vision.
The future investigations and further advances in urban informatics will provides us with more qualified results, but my speculation is the most balanced mix of described bottom-up and top-down methods will be successful. Another challenge is to use emerging technologies as an instrument to design better urban environments on every level. The recently released images of new Songdo City[21] are showing no significantly different urban design then what is have been applied until now. The vision and the hope in better cities have to be accomplished with novel tools to simulate proposed projects before those have been built. Eye candy renderings and feature diagrams are not enough.
[1] Robert Hecht-Nielsen, Neurocomputing (Reading: Addison-Wesley, 1990)
[2] A self-organizing map (SOM) or self-organizing feature map (SOFM) is a type of artificial neural network that is trained using unsupervised learning to produce a low-dimensional (typically two-dimensional), discretized representation of the input space of the training samples, called a map. Self-organizing maps are different than other artificial neural networks in the sense that they use a neighborhood function to preserve the topological properties of the input space (Wikipedia, April 2009).
[3] Prof. Teuvo Kohonen has made many contributions to the field of artificial neural networks, including the Learning Vector Quantization algorithm, fundamental theories of distributed associative memory and optimal associative mappings, the learning subspace method and novel algorithms for symbol processing like redundant hash addressing. He has published several books and over 200 peer-reviewed papers. His most famous contribution is the Self-Organizing Map (also known as the Kohonen map or Kohonen artificial neural networks, although Kohonen himself prefers SOM). Due to the popularity of the SOM algorithm in many research and in practical applications, Kohonen is often considered to be the most cited Finnish scientist. The current version of the SOM bibliography contains close to 8000 entries (Wikipedia, April 2009).
[4] A Bayesian network, belief network or directed acyclic graphical model is a probabilistic graphical model that represents a set of random variables and their conditional independencies via a directed acyclic graph (DAG). For example, a Bayesian network could represent the probabilistic relationships between diseases and symptoms. Given symptoms, the network can be used to compute the probabilities of the presence of various diseases (Wikipedia, April 2009).
[5] Richard Neapolitan, Probabilistic Reasoning in Expert Systems: Theory and Algorithms (New York: John Wiley & Sons, 1990)
[6] Daniel Ames, Bayesian decision networks for watershed management (PhD diss., Utah State University, 2002) 31-74.
[7] Jong-Sung Hwang, “u-City: The Next Paradigm of Urban Development”, in Handbook of Research on Urban Informatics: the Practice and Promise of the Real-Time City, ed. Marcus Foth (New York: Information Science Reference, 2009) 367-379
[8] Francois Bar and Namkee Park, Municipal Wi-Fi Networks: The goals, Practices, and Policy Implications (Communications & Strategies 61, 2005) 107-125
[9] Mark D. Weiser (July 23, 1952 – April 27, 1999) was a chief scientist at Xerox PARC. Weiser is widely considered to be the father of ubiquitous computing, a term he coined in 1988 (Wikipedia, last accessed April 2009).
[10] Mark Weiser, Some computing Science Issues in Ubiquitous Computing (Communications of the ACM, 1993)
[11] Elgar Fleisch, “Business Impact of Pervasive Technologies: Opportunities and Risks”, Human and Ecological Risk Assessment 10/5 (2004), 817-829.
[12] Albrecht Schmidt, “Ubiquitous Computing: Computing in Context” (PhD diss., Lancaster University, 2002)
[13] Michael Katz and Carl Shapiro, “Network Externalities: Competition and Compatibility”, American Economic Review 75 (March 1985), 424-440
[14] http://senseable.mit.edu/ (Accessed April 2009)
[15] http://realtime.waag.org
[16] www.yellowarrow.net
[17] www.urbantapestries.net
[18] Roger Silverstone and Zoetanya Sujon, “Urban Tapestries: Experimental Ethnography”, Technological Identities and Places 7 (London: Media@lse, Department of Media and Communications, 2005)
[19] Kevin Lynch, The Image of the City (Cambridge: Technology Press, 1960)
[20] Mark Shepard, “Extreme Informatics: Toward the De-Saturated City”, in Handbook of Research on Urban Informatics: the Practice and Promise of the Real-Time City, ed. Marcus Foth (New York: Information Science Reference, 2009) 437-450
[21] http://www.new-songdocity.co.kr/ (Accessed April 2009).


You must be logged in to post a comment.